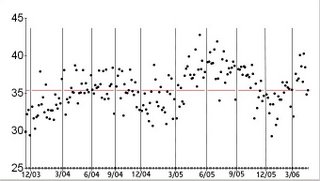
SuperG rightly pointed out that my gas mileage chart would benefit from labels on the x-axis. Unfortunately the program I am working with is so basic that there is no easy way to create the labels. I resorted to doing a screen grab of my graphs after they had been manipulated to make the length of the x-axis approximately equal, pasting it into Adobe PhotoDeluxe, and drawing vertical lines manually to indicate changes into December, March, June, and September for each year. The spacing between lines is not consistent because the data was collected sporadically, each time I put gas in my tank. The more fillups in a given period, the more data points. Full disclosure: I threw out two data points where I only topped off my tank, adding two or so gallons of gas. Because gas mileage is very dependent on the way you drive, I wanted to stick with large sample sizes where individual trip variations would be smoothed out over an entire tank of gas.
 1996 Toyota Tercel fuel economy
(miles per gallon)
11/12/03 - 4/23/06
While I had my little notebook in front of me I decided to punch in all of the prices of gas (per gallon) that I had recorded over the same period. Note that gas prices can vary widely from place to place, especially from state to state, and these data points represent many different filling stations. Still, general trends are obvious: a gradual climb from February through May 2004, stabilizing (or at least showing variation around a semi-constant value) from June 2004 through March 2005. There is another, steeper rise from March 2005 through August 2005, spiking abruptly in the wake of Hurricane Katrina in September 2005. Prices dropped fairly quickly through the end of 2005 - though never below where they were the previous March - but rose again through February 2006, only to drop off again in March - but not to pre-December 2005 levels. Since then prices have risen again to post-Katrina levels.
So, why are prices so high? I'm no economist, and there are plenty of analysts who have actually studied this situation. But I think the undiminished demand for fuel in the days following Katrina caused the people who set the prices on gas - or, shall we say, "the market" - to realize that higher price points will not result in reduction in consumption. It would be a bad business practice for them to sell gasoline for less than people are willing to pay for it. And we are all poorer as a result, save those who are invested in oil stocks.
So how much are you willing to pay for a gallon of gas?


2 comments:
today the answer is $3.11 per gallon ....
Thanks for the update. This would be a great series of data for a classroom. I still don't understand the peak in MPG during summers.... perhaps you drive more efficiently when gas prices are on the rise OR you start taking driving trips.
Post a Comment